
$91 Brent Forecast, $123 Spot (World Bank Commodity Outlook, October 2026): Why the Two Numbers Measure Different Barrels — and What a 23% Commodity Surge Means for Currencies
The World Bank sees Brent averaging $91 in 2026 and $79 in 2027 while physical Brent sits at $123. Why the gap exists, and what 23% dearer commodities do to FX.
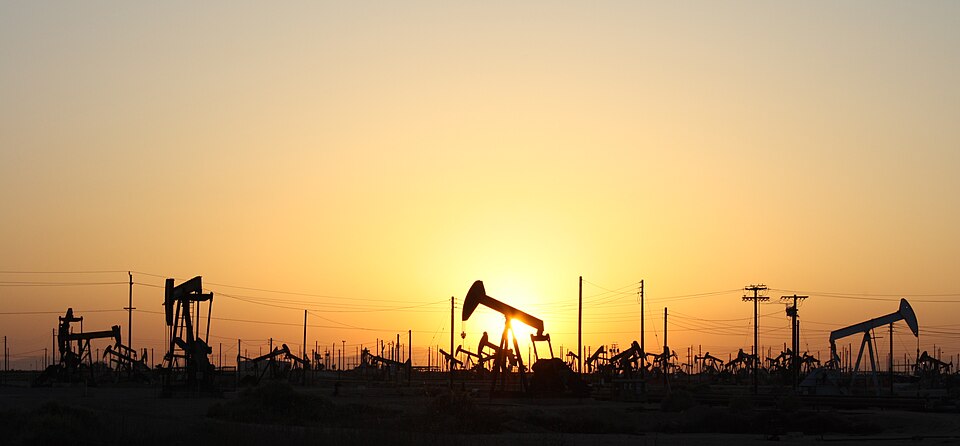
$91 Brent Forecast, $123 Spot (World Bank Commodity Outlook, October 2026): Why the Two Numbers Measure Different Barrels — and What a 23% Commodity Surge Means for Currencies
The World Bank's October 2026 Commodity Markets Outlook, published on 28 October, forecasts Brent crude at an average of $91 a barrel this year and $79 in 2027. On the day before, physical Dated Brent was $123.10. The gap is not a forecast that oil is about to fall by a quarter. It mostly comes from two things: an annual average is not a spot price, and the Bank forecasts a different Brent from the one it records as history.
- The headline. The Bank sees commodity prices up 23% in 2026 and down 7% in 2027. Energy rises 32%, the main driver.
- Brent: $91 in 2026, $79 in 2027, $70 in 2028. Up from $86 and $70 in the April edition.
- Two Brents. The Bank's own footnote says history is Dated Brent (physical) and forecasts are front-month futures. This autumn the physical price has sat several dollars above futures.
- The adverse case is $105. If several shocks hit together, Brent could average $105 in 2027 instead of $79.
- Gold was cut, not raised. $4,600 for 2026, down from $4,700 in April, as high rates weigh on a metal that pays no income.
- Commodities are one of the five factors behind each currency's score. See where CAD, AUD, EUR and JPY rank on the live meter →
What the World Bank published
The press release leads with a 23% rise in commodity prices in 2026, which the Bank attributes to the Middle East conflict, disrupted grain shipments and El Niño. Deputy Chief Economist Ayhan Kose summarised it as markets "being hit by several major shocks at once." The detail is in the forecast table:
| World Bank forecast (Oct 2026) | 2025 | 2026f | 2027f | April 2026f / 2027f |
|---|---|---|---|---|
| Brent crude ($/bbl) | 69.0 | 91.0 | 79.0 | 86.0 / 70.0 |
| European gas ($/mmbtu) | 12.0 | 19.0 | 17.5 | 15.0 / 12.0 |
| Japan LNG ($/mmbtu) | 12.0 | 20.0 | 18.0 | 16.0 / 13.0 |
| Copper ($/t) | 9,947 | 13,200 | 13,000 | 12,000 / 11,000 |
| Gold ($/oz) | 3,442 | 4,600 | 4,250 | 4,700 / 4,300 |
| Wheat, US HRW ($/t) | 243 | 311 | 353 | 253 / 260 |
| Total commodity index (% y/y) | — | +23.1% | −7.0% | — |
Three revisions stand out. Oil was raised for both years, with 2027 lifted by $9. Wheat was raised sharply, and the Bank expects it to keep rising into 2027. Gold, alone among the war-sensitive commodities, was cut.
The supply numbers explain the oil revision. The Bank projects global oil supply to fall 5.2% in 2026, the largest drop in more than four decades outside the 2020 recession. Consumption is projected to fall 2.5%. When supply falls faster than demand, prices have to rise until enough demand is priced out to close the gap. A 2.5% drop in consumption is a measure of how much rationing by price the Bank thinks has already happened.
Why $91 looks low next to $123
A reader who sees a $91 forecast and a spot price above $120 might conclude that the Bank expects a collapse. That reading mixes up three different things.
First, $91 is an average for the whole year. It includes January and February, before the war began, when Dated Brent averaged roughly $67 and $71 on EIA daily data. It also includes June, when the price fell back into the low $80s. A high spot price in October does not have to match a full-year average.
Second, the forecast is not for the same barrel. Footnote 6 of the Bank's table states that historical Brent numbers reflect Dated Brent prices for physical spot transactions, while the forecasts are for front-month Brent futures. In calm markets the two track each other closely. In a war at sea they do not, because a cargo loading in the North Sea within days is worth more than a promise of oil next month.
| Date (2026) | Dated Brent (EIA, physical) | Brent futures, front month | Gap |
|---|---|---|---|
| 20 October | $115.22 | $108.79 (December contract) | $6.43 |
| 27 October | $123.10 | — | — |
Third, the history and the forecast are now pulling apart. On the EIA's Dated series, Brent averaged about $96 across 2026 through 27 October. If the $91 average were measured on that same physical series, the last nine weeks of the year would have to average below $70. That is not what the Bank is saying. It is forecasting futures, and its baseline assumes no major intensification of the conflict. The arithmetic shows how far apart the physical and paper markets have drifted, not that a crash is coming.
The 2027 number is the one that matters
For anyone trading oil-linked instruments, the 2026 average is mostly history. The live question is next year, and the Bank gives two figures for it.
- Baseline: $79. Supply constraints ease gradually and there is no major escalation. Energy prices fall 11.5% in 2027.
- Adverse: $105. The Middle East conflict escalates, damage to Russia's oil infrastructure persists, attacks on Black Sea grain shipments continue and a strong El Niño hits crops, all at once.
The $26 gap between those two numbers is the range of outcomes the Bank thinks is plausible. A futures curve that slopes steeply downward into 2027 is the market's version of the baseline: it says today's tightness is temporary. The adverse case is what happens if that slope turns out to be wrong. Neither number is a target. Each is a statement of what would have to be true about supply.
Why gold was cut during a war
The precious-metals index is forecast to rise 39.9% in 2026, and gold is expected to set a record annual average of $4,600 an ounce, 33.6% above 2025. That is still $100 below what the Bank forecast in April.
The mechanism is the cost of holding something that pays nothing. Energy shocks raise inflation, and central banks in advanced economies have responded by holding rates high rather than cutting. Higher real yields raise the opportunity cost of owning gold, and the Bank names higher interest rates as a drag on non-yielding assets. Safe-haven demand pulls the other way. The revision says that, in the Bank's view, the rates channel has gained ground since April. Our notes on why gold fell during the war and on the dollar–gold relationship cover that tug-of-war in more detail.
What it means for currencies
The outlook reads differently depending on whether a country buys or sells the commodities whose prices are rising.
Energy importers: euro and yen. The Bank sees European natural gas at $19 per mmbtu in 2026, up 58.3%, and Japanese LNG at $20, up 66.7%. Both regions import most of their energy, so higher prices widen their import bills and worsen their terms of trade, the price of what a country sells relative to what it buys. That weighs on the euro and the yen through the trade balance, and it feeds headline inflation, which then shows up in central-bank decisions.
Metals exporters: Australian dollar. Copper is forecast at a record $13,200 a tonne, up 32.7%, and the base-metals index rises 28%. Australia's export mix leans on iron ore more than copper, and iron ore is the exception in the table: the Bank sees it slipping 2.2% to $98 a tonne. That split matters for the Aussie, because a metals boom that bypasses iron ore helps it less than the headline suggests. Our explainer on how commodity currencies work sets out the terms-of-trade channel.
Oil exporters: Canadian dollar. Higher oil is a terms-of-trade gain for Canada, but most Canadian crude is sold into the US at a discount to WTI rather than Brent. A war premium concentrated in physical, waterborne Brent therefore reaches the loonie only partly.
Food: the kiwi and everyone's inflation. The Bank sees food commodity prices up about 10% in 2026 and another 7% in 2027, with US wheat up 28% this year. For importers, food feeds inflation with a lag of several months, which is why a 2027 food forecast can affect rate expectations today. New Zealand exports food, but its main export is dairy, which is not in the Bank's summary table, so the read-across to the kiwi is indirect.
The dollar. The US is a net exporter of oil and gas, so higher energy prices hurt its trade balance less than Europe's or Japan's. For the dollar, the main channel is still inflation and how the Fed responds to it.
What would change the picture
- Hormuz flows. The Bank's baseline depends on shipping recovering. Sustained high-volume transit days would support the $79 path. Repeated near-zero days would push toward the adverse case.
- The physical premium. If Dated Brent stays several dollars above front-month futures, the shortage is still in prompt barrels. A narrowing gap would mean the physical market is catching up with supply.
- Russian infrastructure. The Bank names persistent damage to Russia's oil infrastructure as one of the triggers in its adverse scenario.
- Grain and weather. Black Sea shipping and the strength of El Niño are the inputs for the food forecast, and food is where the 2027 forecast rises rather than falls.
- Rates. If central banks start cutting, the drag on gold that the Bank cites would fade. If they keep rates high for longer, it would persist.
The next Commodity Markets Outlook is due in April 2027. Until then, the forecast is a fixed reference point and the market will move around it. For how commodity prices feed into the meter's currency scores, see how pip theory works.
Educational macro context only — not investment advice.
Frequently asked
What did the World Bank forecast for oil in October 2026?
Why is the World Bank's $91 Brent forecast so far below the current oil price?
What is the World Bank's adverse scenario for oil?
Why did the World Bank cut its gold forecast during a war?
What does the World Bank outlook mean for currencies?
Related reading
Markets4.8M Tons, About 10 Days of US Demand (Russian Diesel Licence, October 2026): Why a Sanctions Waiver Is Not a Supply Increase — and What It Means for Diesel and Oil
Treasury's General License 135 lets Russian diesel sell until 7 April 2027. The announced 4.8M tons is about 1…
13 Oct · 9 min Markets
188,000 Barrels Added, 5.5 Million Shut In: The OPEC+ Meeting of 6 September 2026 — and Why the Quota Stopped Setting the Oil Price
OPEC+ meets at 11:00 GMT on 6 September to set October quotas. With 5.5 mb/d shut in and the 2027 capacity aud…
3 Sep · 13 min Currencies
1.25% Hold Expected, ~80% Priced for December (BoJ Decision Preview, 30 October 2026): What to Expect From the Outlook Report and What It Means for the Yen
The BoJ decides 30 October and is expected to hold at 1.25% while declaring its 2% goal roughly met. Swaps pri…
27 Oct · 10 min